The client and the context
DRIEAT is the Regional and Interdepartmental Directorate for the Environment, Planning and Transport of Île-de-France, a French government agency. It leads a national project, the Sustainable Mobility Dashboard, intended for government agencies and local authorities. The dashboard presents mobility indicators at five geographic scales, from the municipality to the whole of France.
The indicators are calculated in R from public data, stored in a database, then read by a web application. Our engagement covered the R calculation pipeline, while the application is developed by another vendor. The project is led at DRIEAT by Cindie Andrieu-Dupin, whose testimonial is published on this site.
The problem
DRIEAT had a prototype of about a dozen indicators, calculated in an R package written for the first version of the application. Each indicator had its own script, and a lot of code was repeated from one to the next.
To move to the final tool, it wanted the same sequence of steps for every indicator, and functions that other teams in the ministry could reuse for their own calculations. The existing indicators also had to be recalculated to this standard while the application was being developed and was waiting for its first tables.
What we did
Two code repositories. DRIEAT wanted functions that other teams could reuse, so we separated what serves all indicators from what is specific to mobility. The first repository, territoRy, is a generic R package that downloads a source, checks the data, updates municipality codes to the latest official boundaries, aggregates the results at the five scales and writes them to the database. The second contains the mobility indicators and builds on the first, which another team can reuse without the second. In Cindie Andrieu-Dupin’s words: “the Data Champ’ team very quickly proposed this breakdown into two packages that were optimized throughout the mission”.
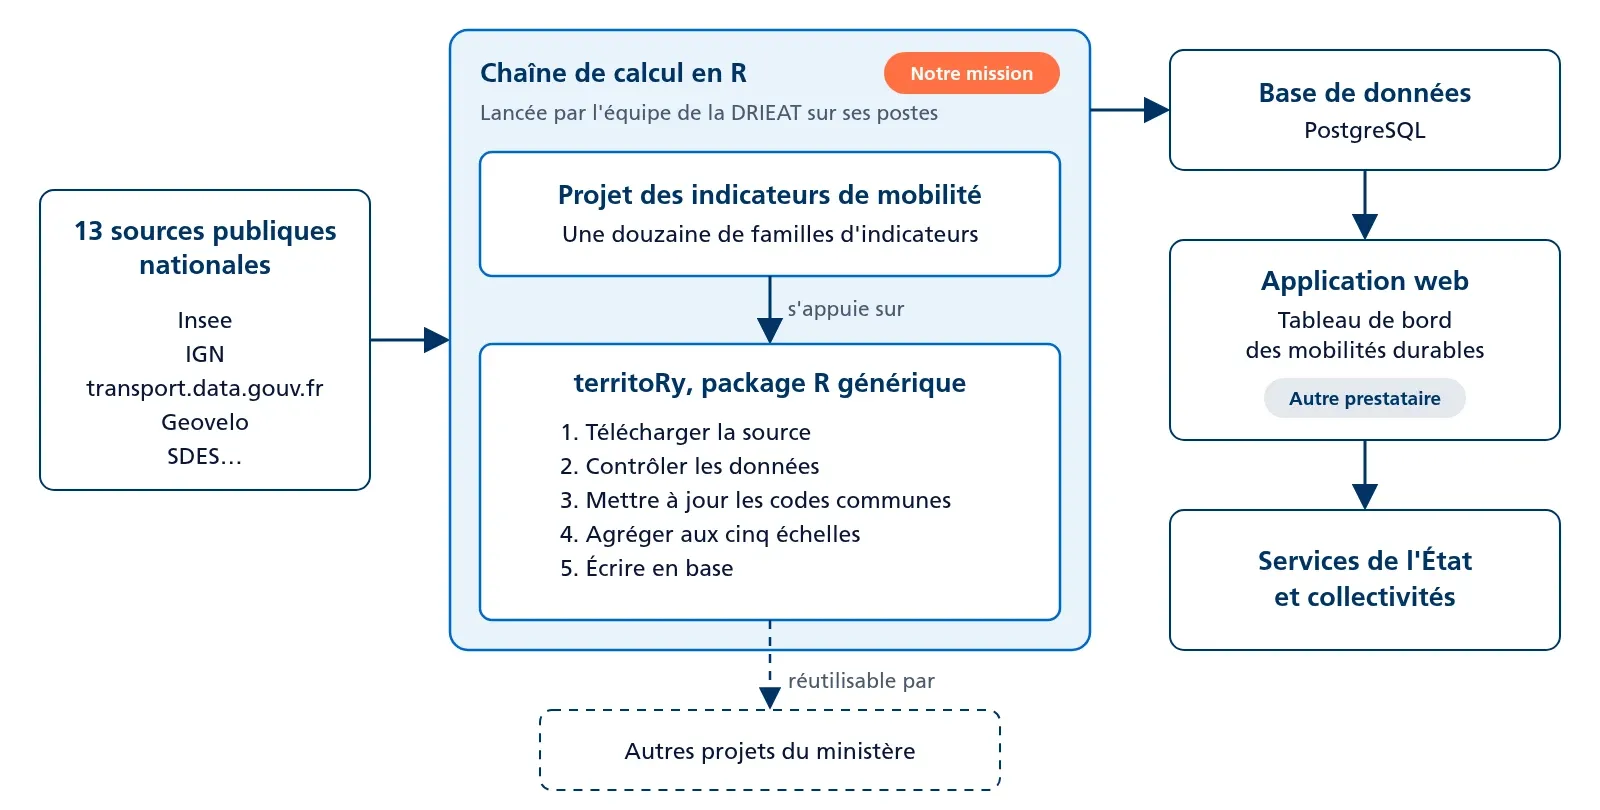
The same steps for every indicator. Each calculation goes through extraction, harmonization, municipality code updates and aggregation. The dozen indicator families and their 13 national public sources are described in reference files. To add a year of data, the team fills in one line in the sources file and reruns the calculation. The package ships with automated tests and documentation that describes, step by step, how to add an indicator.
Checks carried out with DRIEAT. At each delivery, the DRIEAT team reran the calculations on its own computers and reviewed the values, and we looked for the cause of each discrepancy together. The first count of metro stations in Paris, for example, gave 656 where DRIEAT expected 303, because it counted every stop while a station groups several of them. The checks useful to all indicators, such as looking for duplicates or missing municipalities, became functions of the package.
The challenge: calculations too heavy for the ministry’s computers
DRIEAT staff run the calculations on their office PCs, under Windows, behind the ministry’s network. The data analyst’s PC has 16 GB of memory, and two indicators needed more than that.
The first is the number of public transport stations. It is calculated from GTFS files, the format in which transport networks publish their timetables and stops. There are about 500 such datasets for France, which amounts to several hundred million rows, and loading 100 at a time already required more than 40 GB of memory on our machine. The idea of processing the networks one by one came out of a discussion with the DRIEAT team. The calculation reads one network, extracts its stops, frees the memory and moves on to the next, and we measured a peak of 7 GB across the 500 datasets.
The second is the length of cycling infrastructure in each municipality. Calculating it means intersecting each segment with the municipal boundaries, and we handed that operation to DuckDB, a database engine that runs on the PC itself, and to its spatial extension. Because the ministry’s network prevented DuckDB from downloading this extension on its own, we added an installation mode in which R downloads the file, then installs it from a local folder. It took several attempts with the team before the calculation ran on their computers.
Cindie Andrieu-Dupin says of this work: “They knew how to work around these limitations to offer us solutions that optimized certain complex calculations requiring specific processing.”
The results
DRIEAT has a generic package and a project that calculates its mobility indicators, some of which did not exist in the prototype.
Its team extends them without us. In the testimonial, Cindie Andrieu-Dupin said: “we’ve taken ownership of the package and we’re more autonomous in adding new indicators. We’ve already added a few since the end of the service.” Six months after the end of the engagement, DRIEAT’s own data analyst was maintaining territoRy, and the team was preparing to move all the indicators to the new municipal boundaries.
According to the same testimonial, other projects in the ministry are starting to use the package, including a tool on the energy renovation of housing. The Sustainable Mobility Dashboard is now online.
Do you have indicators to calculate from public data, or R code that your team needs to be able to maintain? Get in touch.